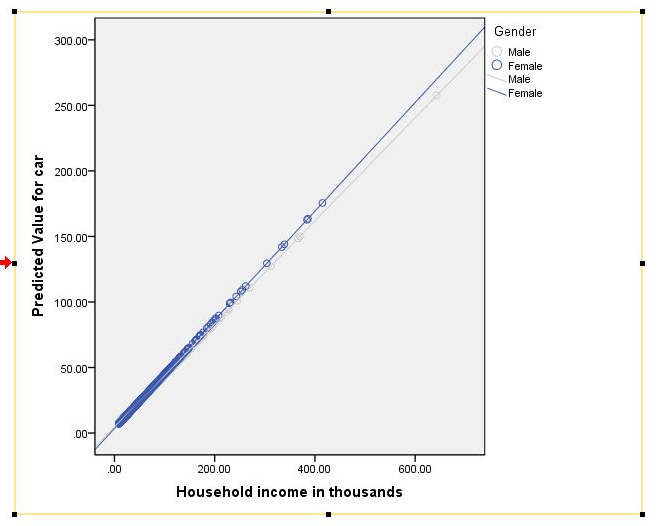
So you've run your general linear model (GLM) or regression and you've discovered that you have interaction effects. Now what? Next, you might want to plot them to explore the nature of the effects and to prepare them for presentation or publication! The following is a tutorial for who to accomplish this task in SPSS. A follow-up tutorial for how to do this in R is forth coming.
Read MorePart 3 we used the lm() command to perform least squares regressions. In Part 4 we will look at more advanced aspects of regression models and see what R has to offer. One way of checking for non-linearity in your data is to fit a polynomial model and check whether the polynomial model fits the data better than a linear model. Or you may wish to fit a quadratic or higher model because you have reason to believe that the relationship between the variables is inherently polynomial in nature.
Let’s see how to fit a quadratic model in R...
Read MoreIt is quite common in political science for researchers to run statistical models, find that a coefficient for a variable is not statistically significant, and then claim that the variable "has no effect." This is equivalent to proposing a research hypothesis, failing to reject the null, and then claiming that the null hypothesis is true (or discussing results as though the null hypothesis is true). This is a terrible idea. Even if you believe the null, you shouldn't use p > 0.05 as evidence for your claim. In this post, I illustrate why...
Read MoreI received a great question this week, which asked: In order for a moderating relationship to exist, do the predictor IV and dependent variable need to be significantly correlated?". This is a question that I am asked a lot, partly because of the common confusion between mediators and moderators and the commonly held belief that an IV and DV should be related for mediation to be present (see my video blog on Mediators, Moderators, and Suppressors for more info on this topic). However, moderators are a completely different story...
Read MoreWhen I hear the word "residual", the pulp left over after I drink my orange juice pops into my brain, or perhaps the film left on the car after a heavy rain. However, when my regression model spits out an estimate of my model's residual, I'm fairly confident it isn't referring to OJ or automobile gunk...right? Not so fast, that imagery is more similar to it's statistical meaning than you might initially think.
Read MoreMulticollinearity said in "plain English" is redundancy. Unfortunately, it isn't quite that simple, but it's a good place to start. Put simply, multicollinearity is when two or more predictors in a regression are highly related to one another, such that they do not provide unique and/or independent information to the regression.
Read MoreThe Bonferroni correction is only one way to guard against the bias of repeated testing effects, but it is probably the most common method and it is definitely the most fun to say. I've come to consider it as critical to the accuracy of my analyses as selecting the correct type of analysis or entering the data accurately. Unfortunately adjustments for repeated testing of hypotheses, as a whole, remains something that is often overlooked by researchers and the consequences may very well be inaccurate results and misleading inferences. In this independence day blog, I'll discuss why the Bonferroni Correction should be as important as apple pie on the 4th of July.
Read MoreMediators, Moderators, and Suppressors are two of the most often confused statistical concepts in social science research. Our first installment of The Stats Make Me Cry Guy's Deviant Square Video Podcast clarifies the confusion that surrounds these concepts, and hopeful gets a laugh or two in the process!
Read More


